Volatility & Systematic Strategy Lab
Gold and yen clear the breakeven win rate for defined-risk spreads; EUR-correlated pairs sit just below it.
At a glance
- XAUUSD / USDJPY trade Sharpe
- 0.41 / 0.40
- Win rate vs breakeven
- 73% vs 70%
- Sample
- 2005–2026
About this project
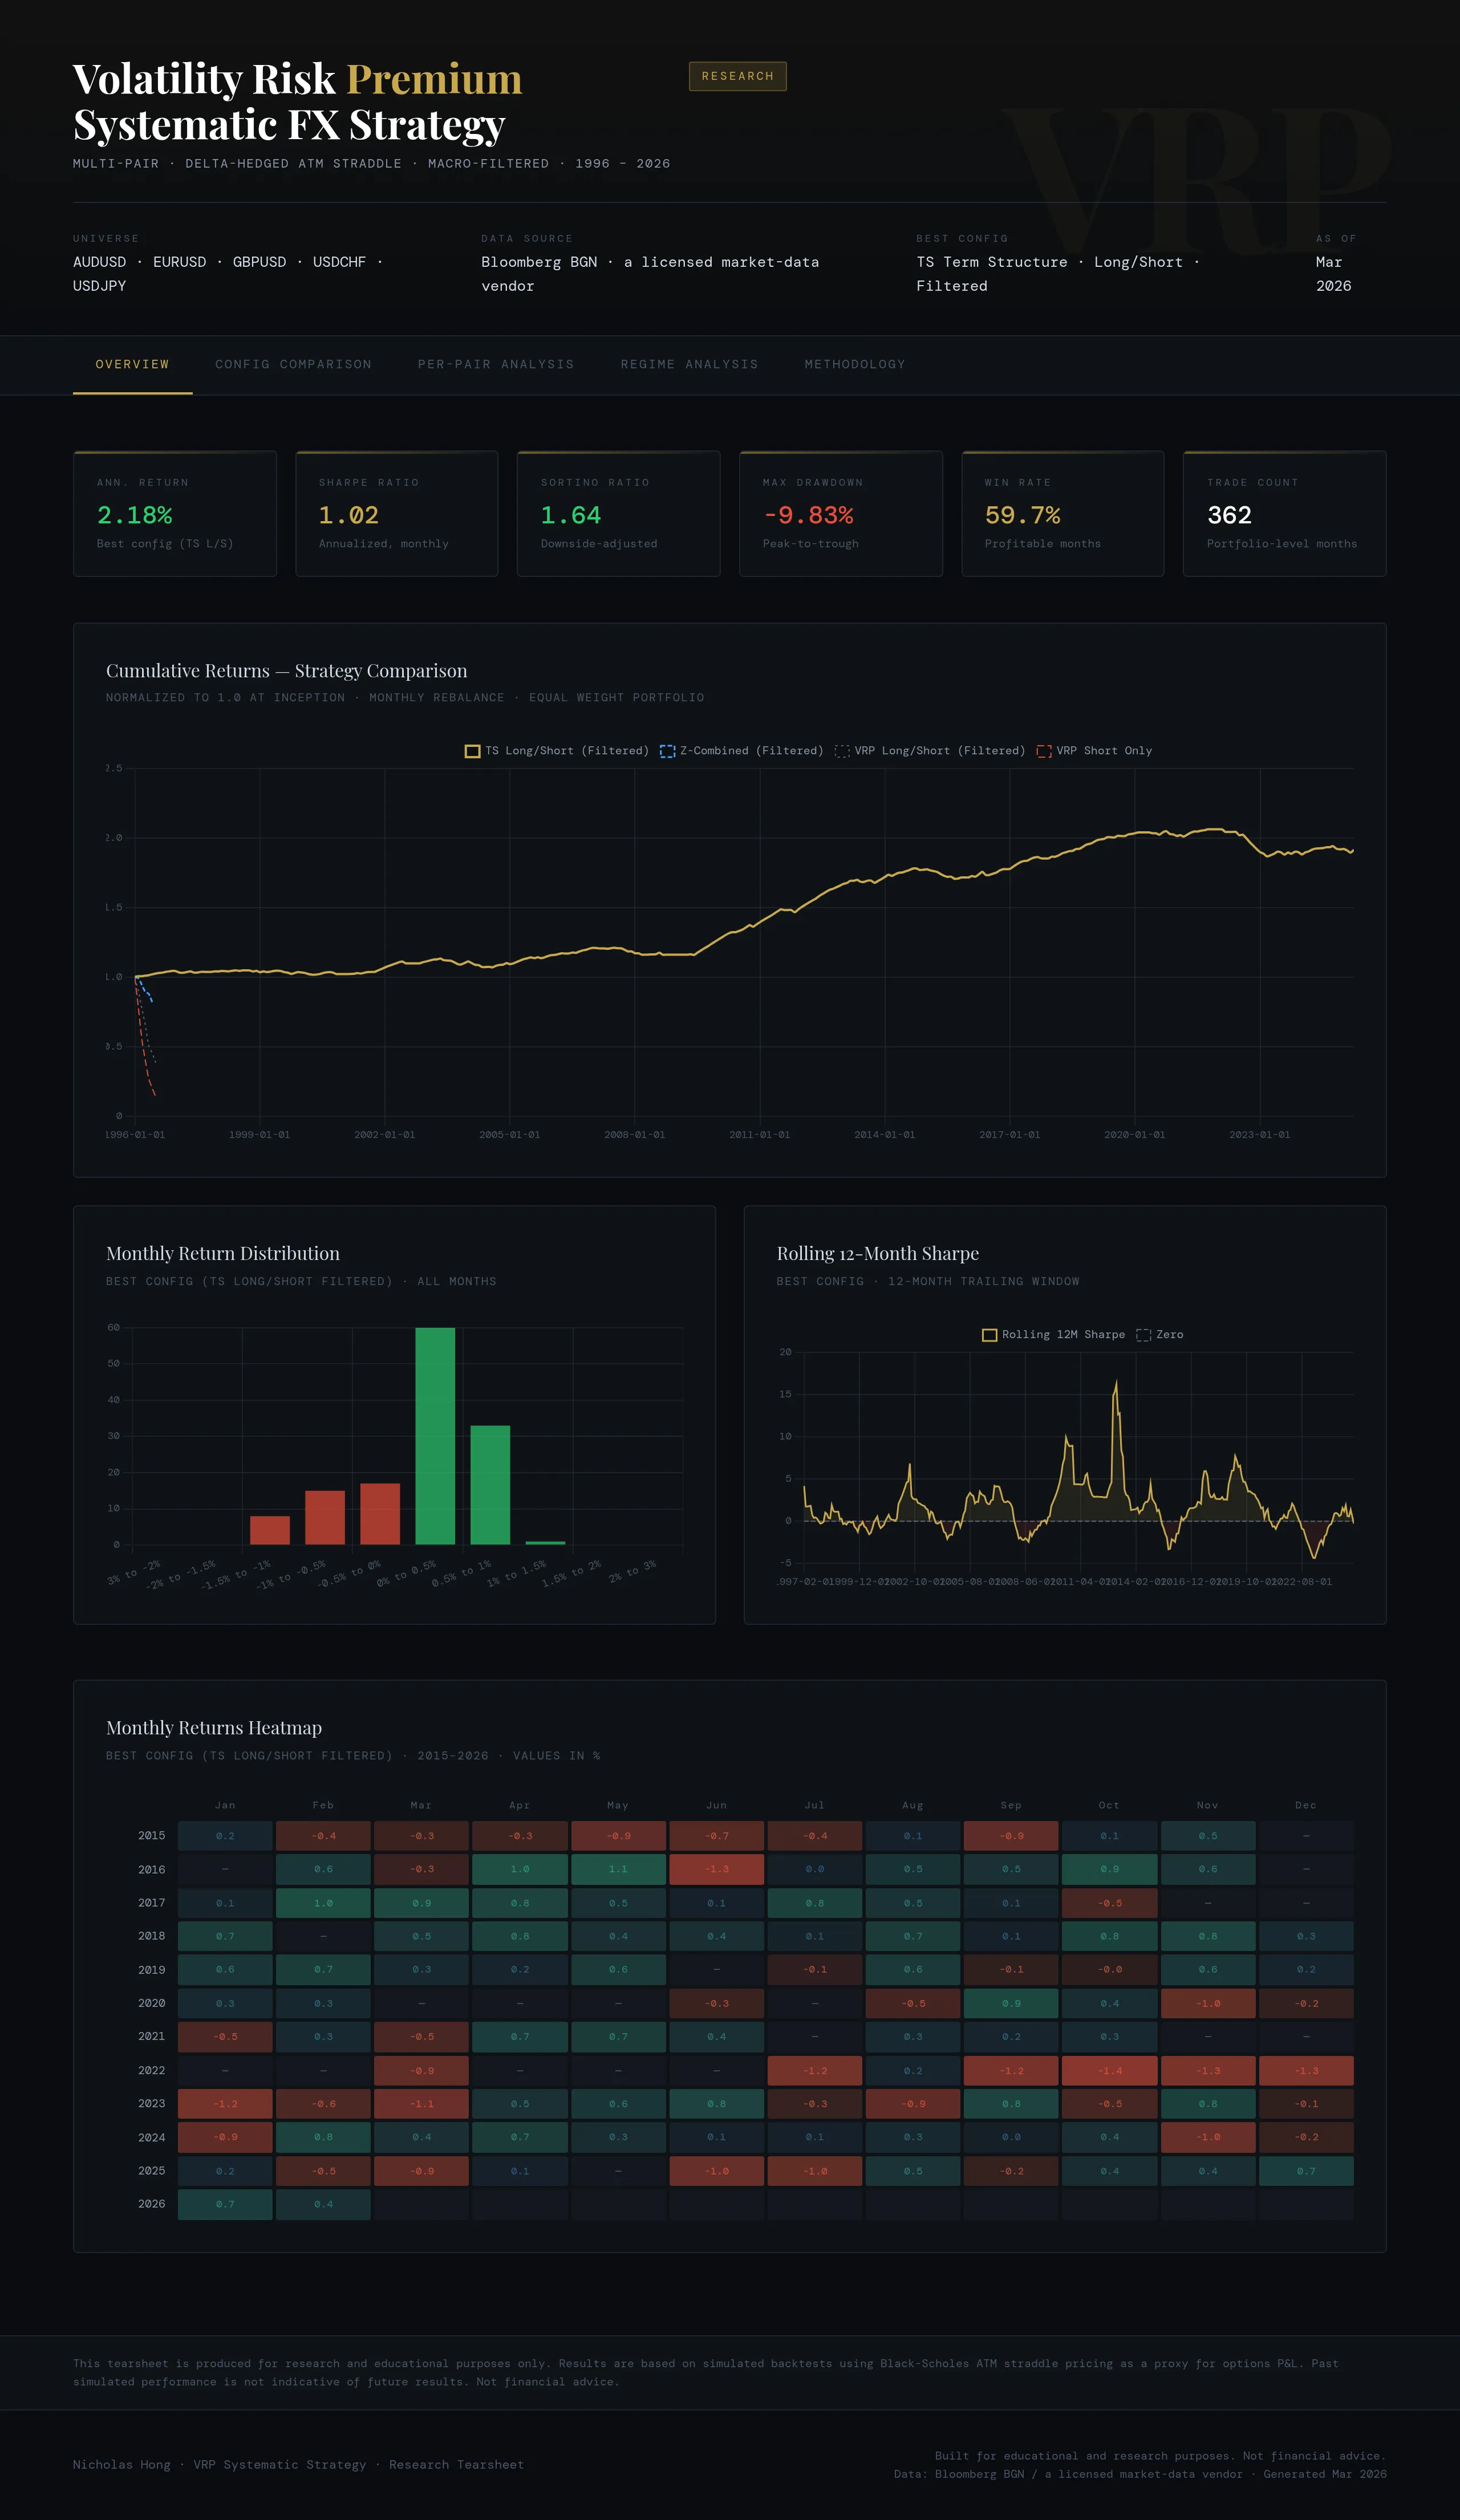
A multi-strategy research lab built around the volatility risk premium. A VRP strategy across FX spot and options (defined-risk 20Δ/10Δ spreads, 200-day trend filter, 45 DTE entry) backtested 2005–2026 on Bloomberg BGN implied and realised volatility: gold and yen clear breakeven (trade-level Sharpe about 0.40, win rate about 73%), while EUR-correlated pairs sit just below, reflecting structurally thinner premium. Plus a Black-76 options-on-futures pricing engine with greeks, a CRR American pricer and self-tests, Johansen/VECM relative-value pairs, and mean-reversion and momentum modules.
Why it matters
This is the strategy-construction side of the volatility work: how a premium turns into a defined-risk trade with a trend filter and a lifecycle, and what win rate the payoff asymmetry requires. The exchange-level measurement of the premium itself lives in the FX options VRP project.
Methodology
- Event-driven backtester with option lifecycle (enter 45 DTE, exit at 50% profit, 2× stop or 21 DTE), 5% risk-per-trade sizing, and trade-level Sharpe to avoid daily mark-to-market noise.
- Black-76 pricing, greeks and implied-volatility inversion (Newton with bisection backstop), CRR American reference pricer and a European-vs-American bias report.
- Johansen/VECM cointegration, spread z-score and walk-forward backtest for pairs; bear-market-reversal screener and momentum dashboard as supporting modules.
Strongest findings
- XAUUSD and USDJPY exceed the roughly 70% win rate required to break even at a 2.35× loss-to-win ratio (trade Sharpe 0.41 and 0.40, max drawdown −11% and −6%).
- USDCHF and GBPUSD sit just below breakeven (trade Sharpe about zero), consistent with thinner premium in EUR-correlated pairs.
Figures
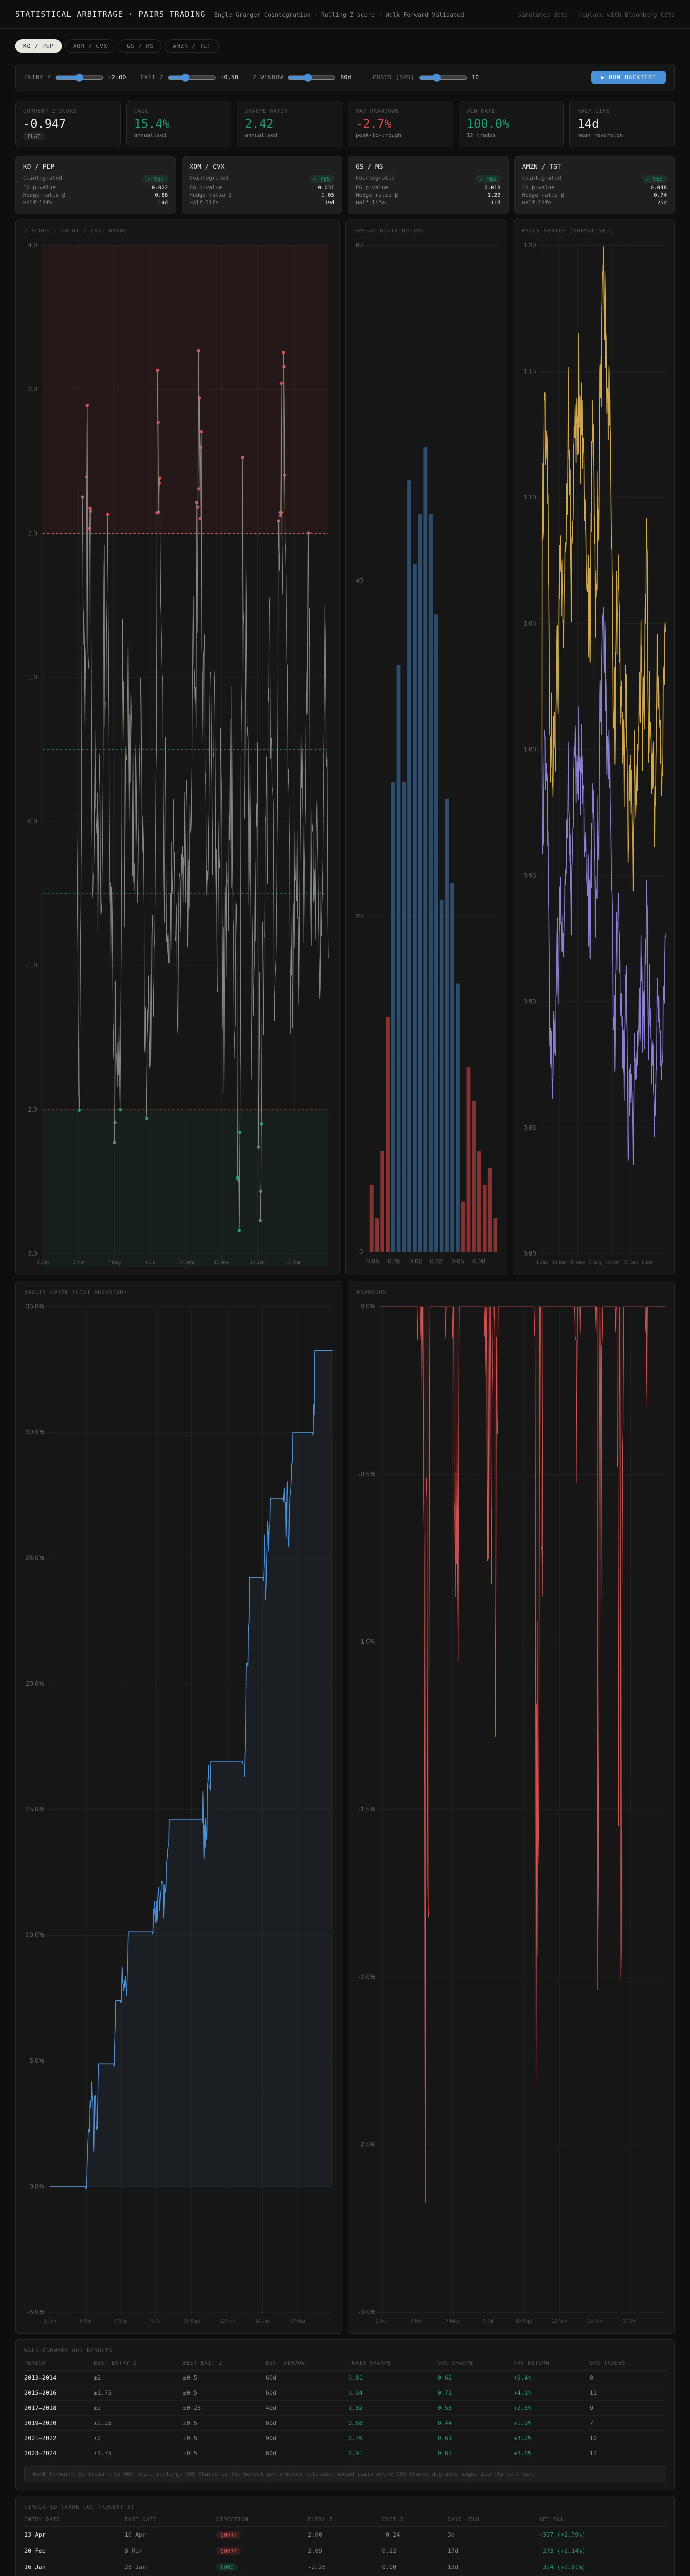
Figure 1. Relative-value pairs dashboard: Johansen/VECM cointegration, spread z-score and walk-forward backtest.
Robustness and caveats
- Bloomberg BGN implied-volatility inputs are not redistributed; the strategy is evaluated on 1M/3M vol marks rather than executable option prices.
- Trade-level Sharpe is the honest measure for spread strategies but is not comparable to daily-return Sharpe ratios elsewhere on this site.
Challenges
Building an event-driven backtester, aligning option-chain expiries, and pricing options on futures correctly with early exercise.
Learnings
Derivatives greeks, the macro-volatility interplay, and that the VRP is real but thin and asset-dependent.