Macro VAR Research Lab
Across 1,000+ specifications and five estimator classes, no model is distinguishable from a univariate AR; shocks and identification add nothing out of sample.
At a glance
- Studies, papers
- 3, 3
- Unique models in walk-forward
- 1,014
- Estimators beating a univariate AR (MCS)
- 0
- HP-filter endpoint look-ahead
- 66% of cycle std
About this project
A consolidated lab of three completed studies on US quarterly data from public sources (FRED, FRBSF, NY Fed, ALFRED). Study 1 is a disciplined specification search and model-class horse race with the Model Confidence Set. Study 2 is a BVAR-with-constructed-shocks density study that exposes and fixes the common failures of that practice. Study 3 is a 1,014-model VARX permutation study with a real-time ALFRED replication, externally identified shocks, forecast combination and density evaluation, plus an interactive console.
Why it matters
Applied macro forecasting gives the analyst enormous freedom to search over variables, transforms, lags and estimators. These studies measure what that freedom buys when it is disciplined: very little. For anyone building macro views into a portfolio process, knowing which sophistication does not pay is as valuable as a model that does.
Methodology
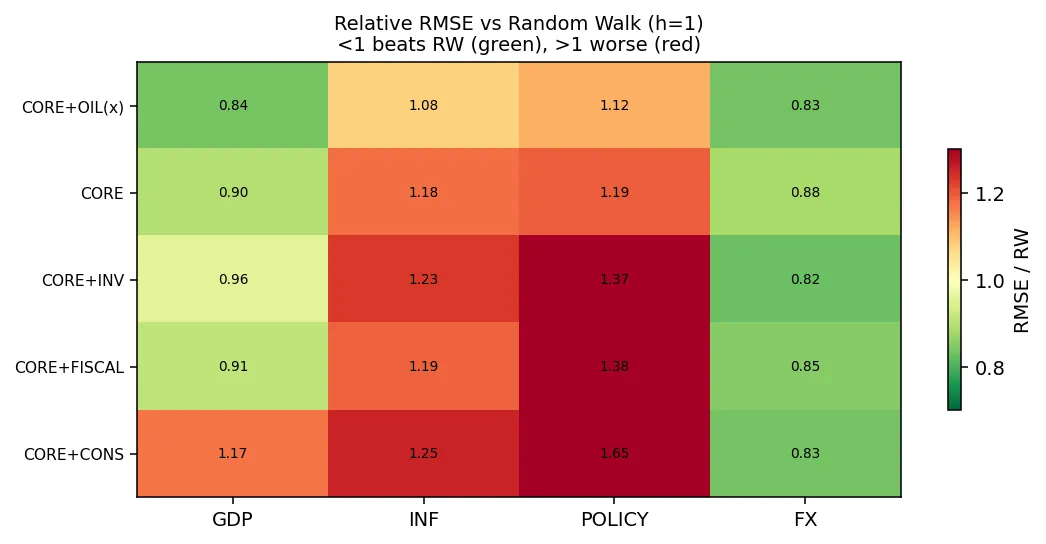
- Study 1: theory-pruned block forward selection with hard validity gates (stability, residual whiteness, parsimony, conditioning); relative RMSE versus random walk and AR benchmarks; Clark-West, Diebold-Mariano and the Model Confidence Set across OLS, Minnesota BVAR, ridge, LASSO and elastic-net; a single-seed reproduce.py regenerates every number.
- Study 2: Minnesota BVAR via dummy observations versus a naive implementation; shocks as AR(1) surprises standardised on the training window only; expanding-window evaluation over 48 origins scored by CRPS, log score and Diebold-Mariano; stochastic-volatility BVAR; Johansen cointegration; G7 panel extension.
- Study 3: 16 endogenous sets × 12 shock subsets × 3 treatments × 3 lag rules = 1,632 cells, 1,014 unique models, expanding walk-forward from 2009Q4 at h = 1, 4, 8; real-time rebuild on ALFRED vintages; Kaenzig oil and Bauer-Swanson FOMC shocks as identified alternatives; forecast-encompassing tests; plug-in versus shock-uncertainty densities; Bayesian coverage decomposition.
Strongest findings
- Study 1: the disciplined baseline is a four-variable core plus oil as an exogenous regressor; no estimator class beats a univariate AR by a Model Confidence Set margin; full-sample HP filtering of the policy rate leaks the future by 66% of the cycle’s own standard deviation at the endpoint; year-over-year transforms fail every whiteness test.
- Study 2: a naively coded Minnesota prior leaves the posterior unshrunk (largest companion eigenvalue 1.068) while dummy observations restore stability (0.96); stacking all shocks inflates out-of-sample error by an order of magnitude; a stochastic-volatility BVAR produces sharper, better-calibrated densities than random-walk and AR(1) benchmarks for output and inflation.
- Study 3: shocks cut the best GDP RMSE by about 12% at one quarter, but only 4.0% of specifications beat the core VAR at the 5% level, which is what noise delivers; the gain survives real-time vintages (16.1% → 15.9%); externally identified shocks do not beat cheap growth-rate proxies (encompassed in 22 of 24 cells); the shock model’s 90% interval covers 68% of outcomes until future-shock risk is priced.
Figures
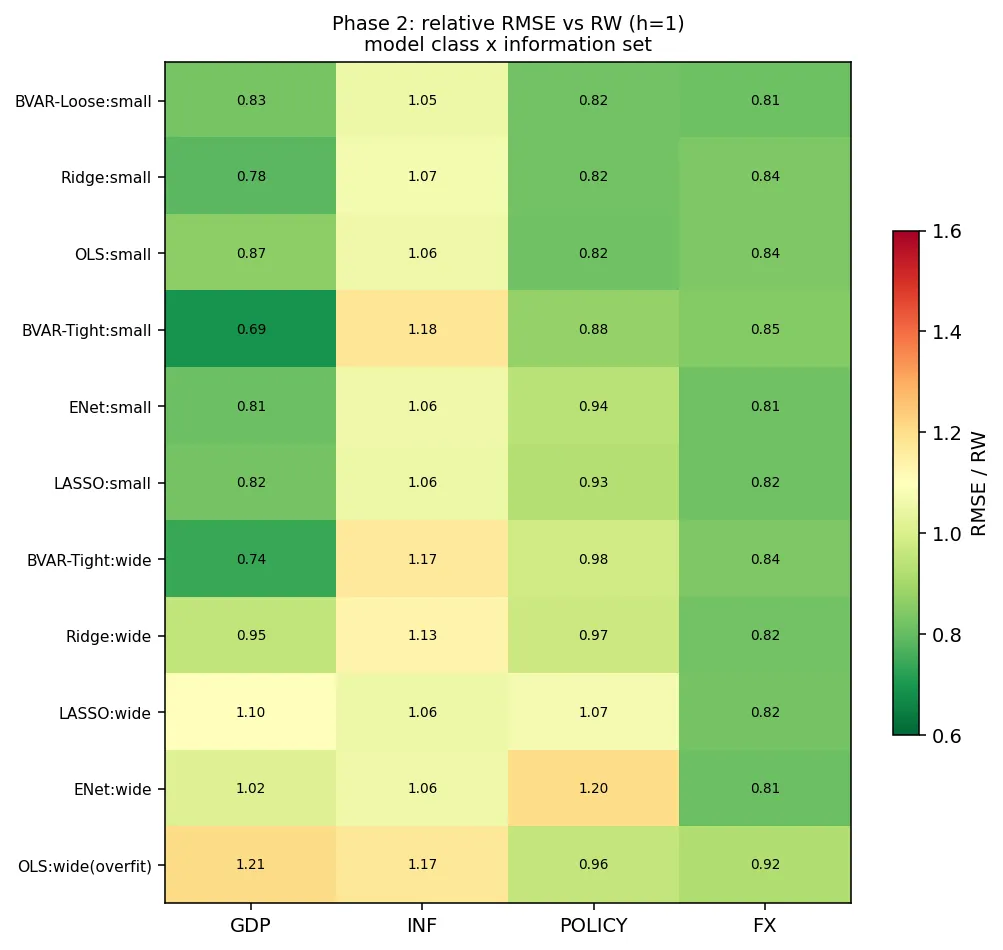
Figure 1. Study 1: model classes × information sets. No estimator separates from the univariate AR under the Model Confidence Set. 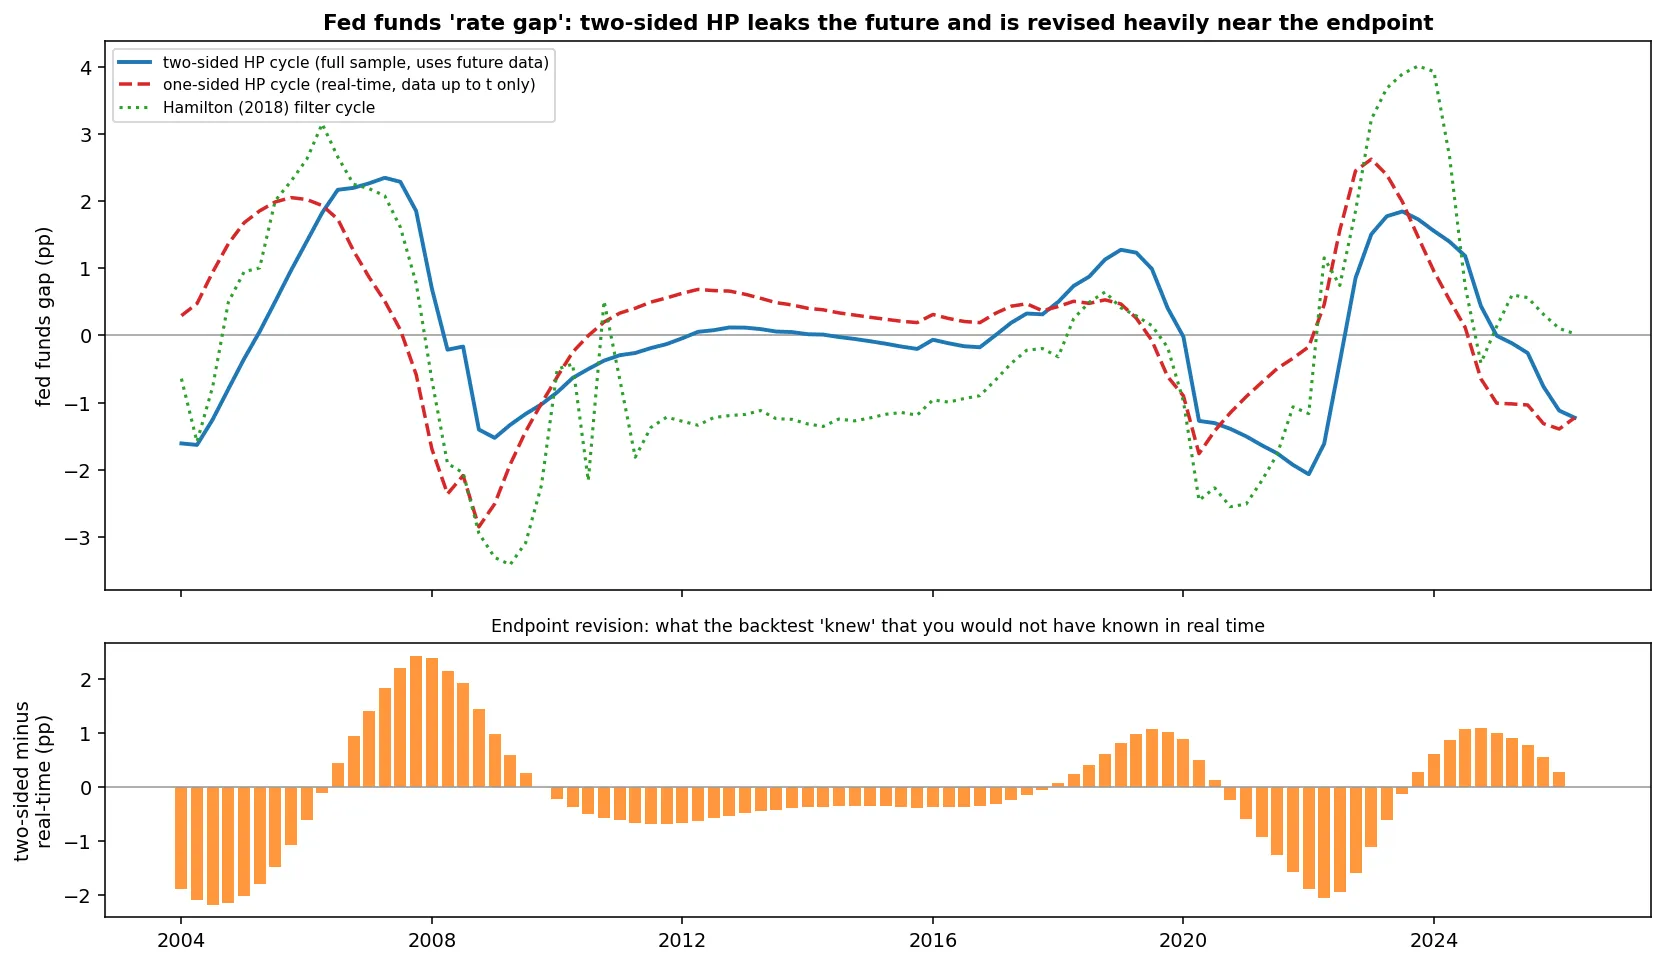
Figure 2. Study 1: the two-sided HP cycle of the fed funds rate is revised by up to 66% of its own standard deviation at the endpoint; a real-time filter does not see it. 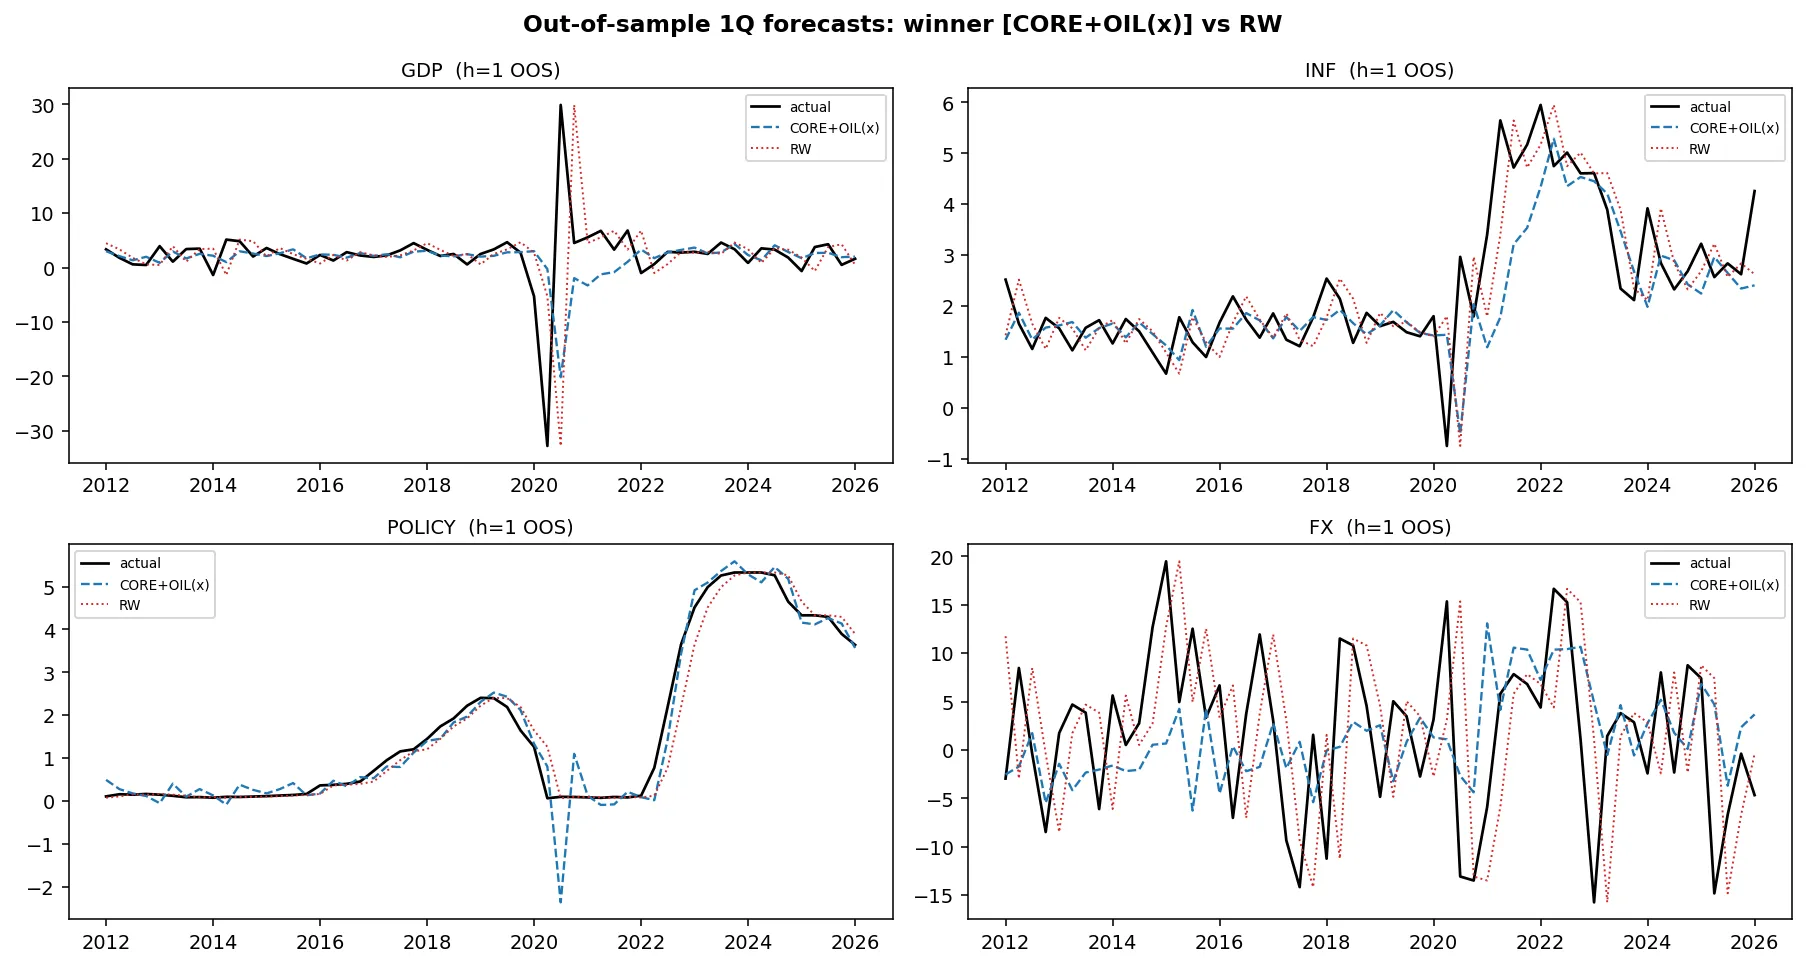
Figure 3. Study 1: one-quarter-ahead out-of-sample forecasts of the winner against the random walk. 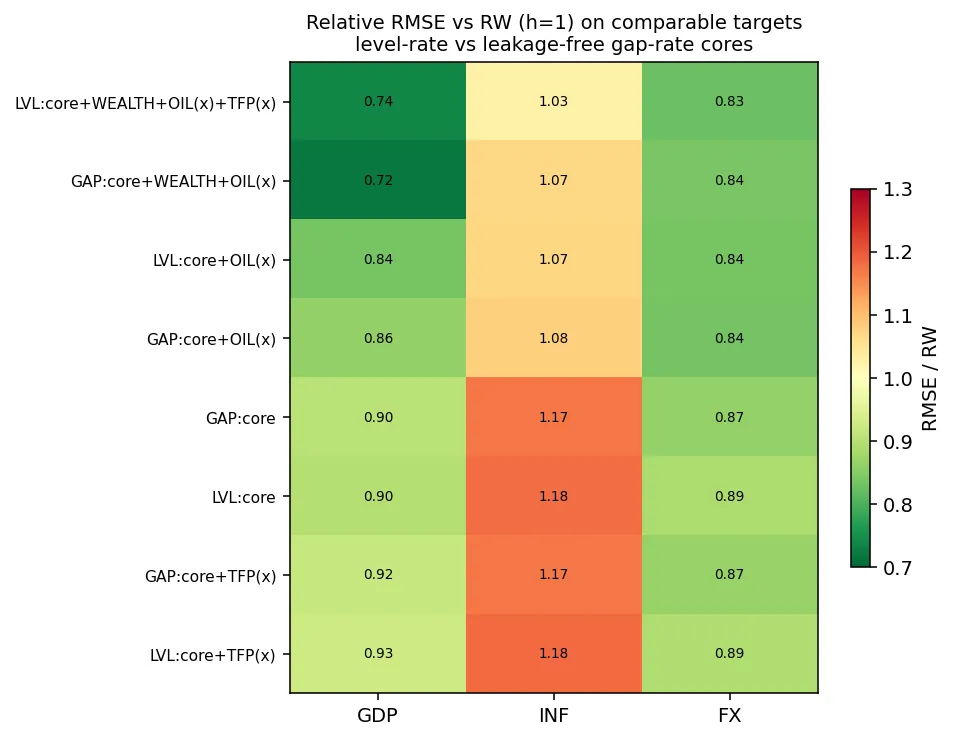
Figure 4. Study 1: representing the policy rate as a gap rather than a level is a tie once the gap is built without look-ahead. 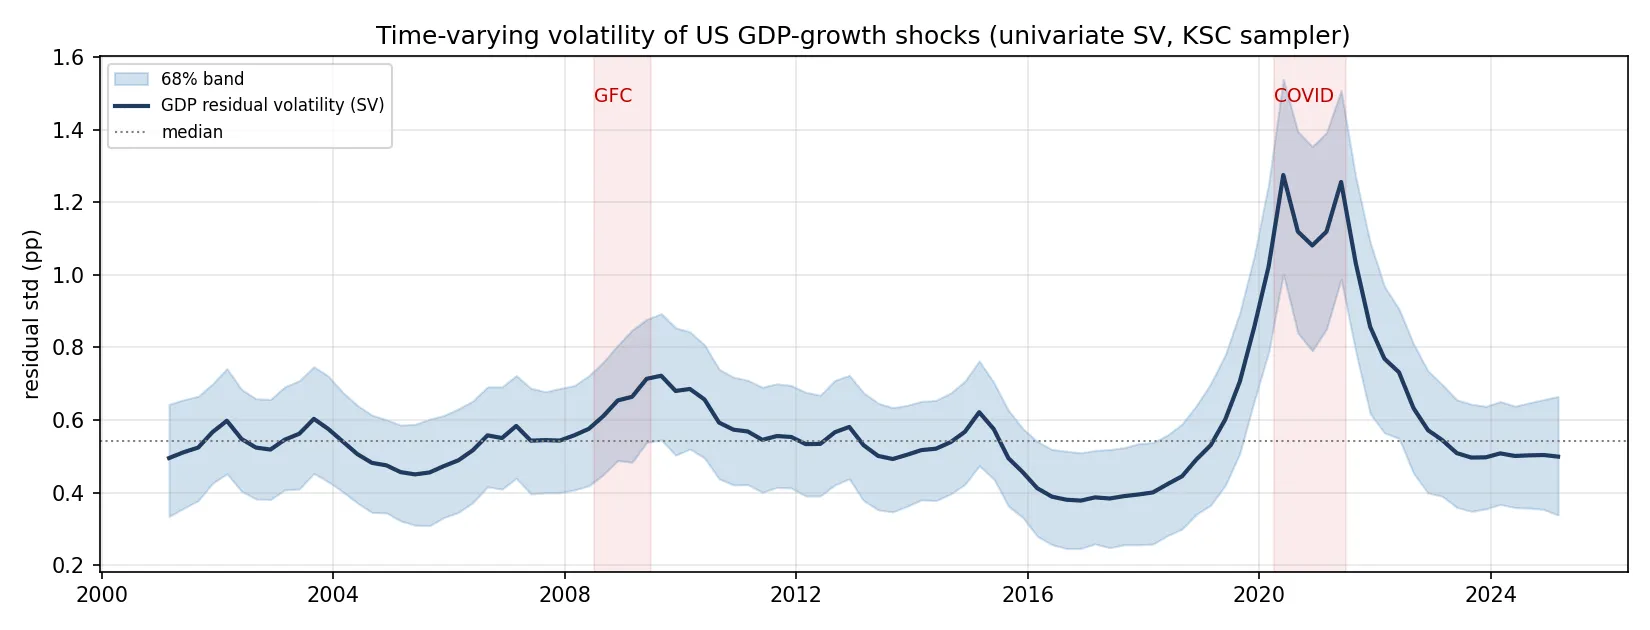
Figure 5. Study 2: stochastic-volatility path of US GDP-growth shocks with the GFC and COVID spikes; the motivation for variable-specific volatility. 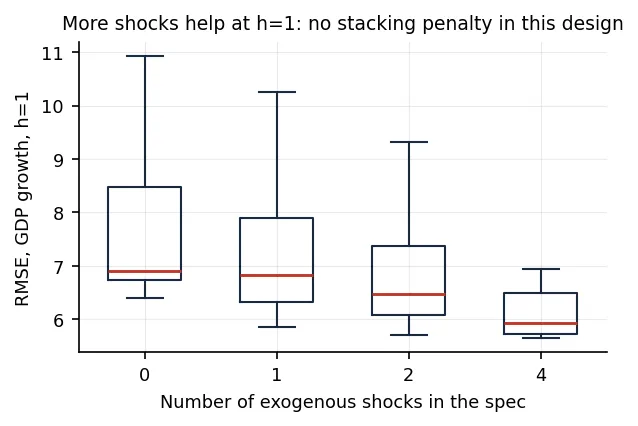
Figure 6. Study 3: adding shocks lowers one-quarter GDP RMSE across 1,014 models, but the leaderboard order is one member of a large statistically equivalent set. 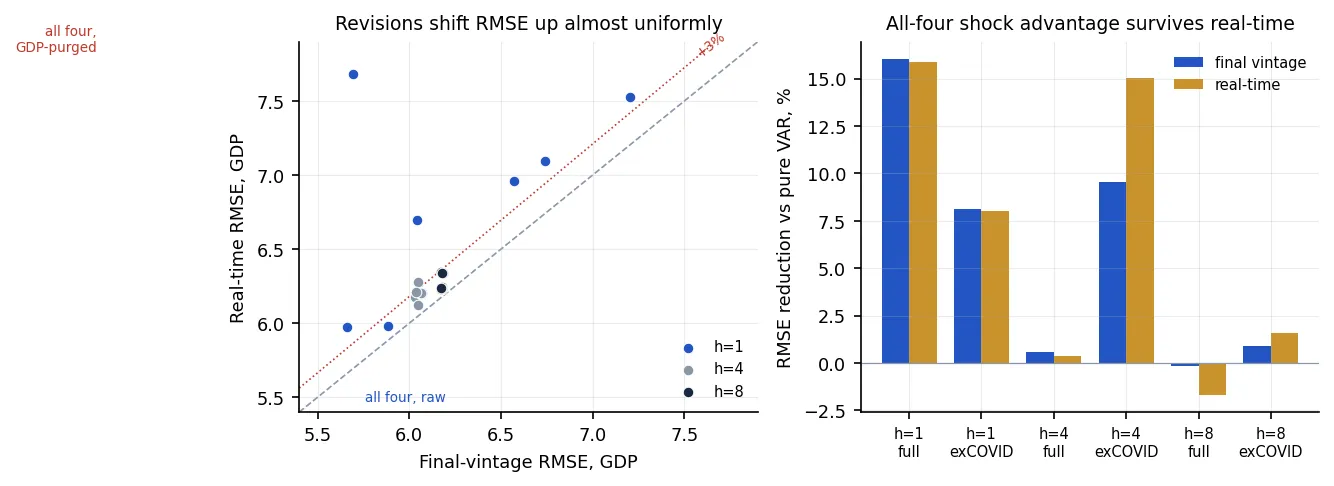
Figure 7. Study 3: the shock advantage survives an ALFRED real-time rebuild almost intact (16.1% to 15.9% RMSE reduction). 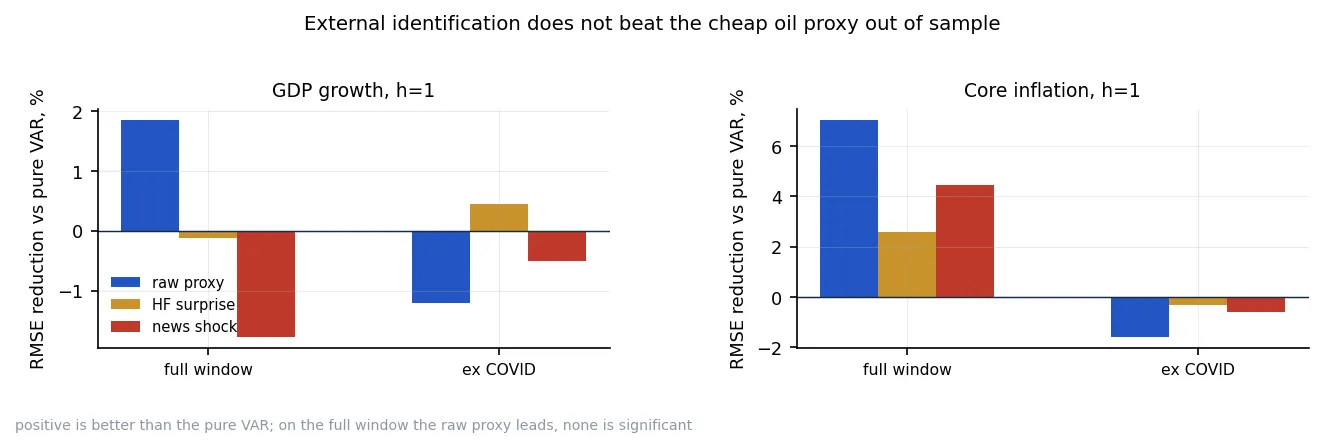
Figure 8. Study 3: the Kaenzig oil-supply-news shock does not beat the raw real-oil-price growth proxy out of sample, even with a full-sample look-ahead the proxy lacks. 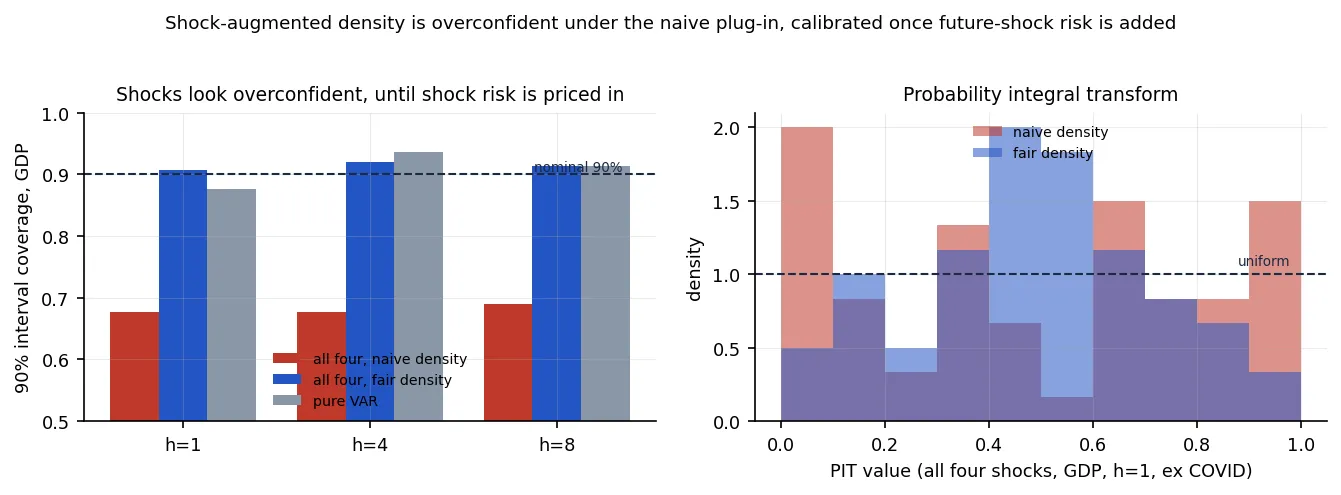
Figure 9. Study 3: under a plug-in density the shock model’s nominal 90% GDP interval covers 68% of outcomes; pricing future-shock risk restores 91% and removes the sharpness advantage.
Robustness and caveats
- Short samples (roughly 100–130 quarters) limit the power of every test; the Model Confidence Set is the guard against reading noise as discovery.
- Study 2’s shock inputs were constructed from spreadsheet exports of public series that are not redistributed; the series list is documented so they can be rebuilt.
- Study 1’s Phase C Model Confidence Set depends on the pinned arch version recorded in the results file.
Challenges
Implementing a leakage-safe walk-forward protocol at scale, the Minnesota BVAR with sum-of-coefficients and dummy-observation priors, the Model Confidence Set, and a real-time replication on archival vintages; then consolidating three separately built studies into one repository without rewriting any result.
Learnings
Disciplined parsimony and leakage-free evaluation dominate methodological sophistication in short macro samples. An honest negative result is worth more than an overfit positive one.