Treasury Futures Curve: Momentum and Mean Reversion
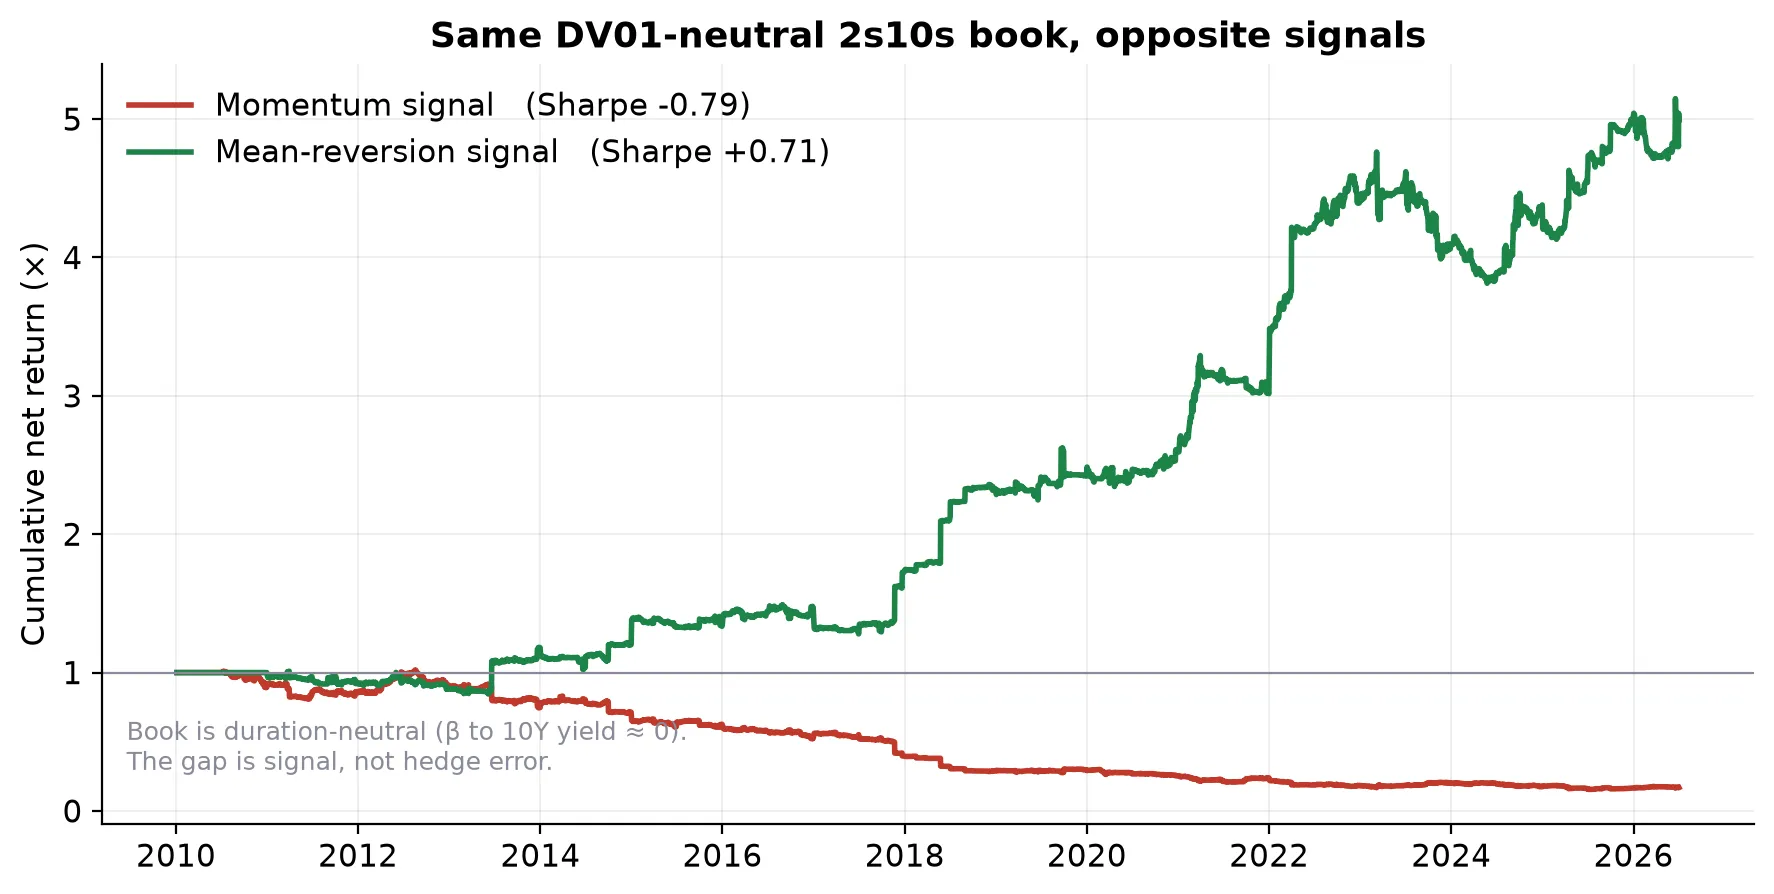
The same DV01-neutral 2s10s book earns a net Sharpe of −0.79 under a momentum signal and +0.71 under mean-reversion.
At a glance
- Same 2s10s book: momentum vs reversion
- −0.79 vs +0.71
- Duration momentum, net Sharpe
- 0.68
- Curve vs baseline, DM p-values
- 0.41 / 0.49
- Sample, net of costs
- 2010–2026
About this project
A systematic study of time-series momentum on outright duration and mean-reversion on DV01-neutral curve spreads (2s10s, 5s30s, 2s5s10s) in U.S. Treasury futures from January 2010 to July 2026. A carry extension was subsequently tested as a secondary study and failed its pre-specified promotion criteria, so it is documented as a null rather than folded into the headline result. Continuous, back-adjusted futures are rebuilt from the exchange roll map, curve trades are hedged to be DV01-neutral using the daily cheapest-to-deliver forward risk, and every strategy is evaluated net of tick costs with HAC Diebold-Mariano inference against a duration-momentum baseline.
Why it matters
Time-series momentum on outright duration is well known. The question a rates desk actually faces is whether the same signal works on the curve. It does not: the slope mean-reverts, and applying a trend signal to it is a systematic way to lose money even on a perfectly hedged book. The asymmetry is the finding; the honest part is that the curve trades do not statistically beat the outright baseline.
Methodology
- Six futures roots (TU, FV, TY, UXY, US, WN), first three generics; continuous series rebuilt from FUT_CUR_GEN_TICKER with difference back-adjustment so roll gaps are never booked as returns.
- DV01 from Bloomberg’s daily cheapest-to-deliver forward risk (CONVENTIONAL_CTD_FORWARD_FRSK), the real per-day sensitivity rather than a regression proxy.
- No look-ahead: signals use t−1 data, execution at the t settle, monthly rebalance, 126-day warm-up, leverage capped at 3×, volatility scaled to 10%.
- Costs of one tick per contract per side using each contract’s own tick size (the 10-year tick was halved during the sample).
- Diebold-Mariano with Newey-West long-run variance at a 21-day lag plus the Harvey-Leybourne-Newbold small-sample correction, cross-checked against HAC-robust OLS.
Strongest findings
- On the identical DV01-neutral 2s10s book, momentum loses (net Sharpe −0.79) and mean-reversion earns +0.71; the book’s P&L regression slope on the 10-year yield change is −0.001, so the gap is signal, not hedge error.
- Net of one tick per contract per side, 2010–2026: duration momentum 0.68 (max drawdown −23%), 2s10s mean-reversion 0.71 (−20%), 5s30s mean-reversion 0.66 (−27%), 2s5s10s butterfly 0.07 (−38%).
- Against the baseline, HAC Diebold-Mariano gives DM = 0.83 (p = 0.41) for 2s10s and 0.68 (p = 0.49) for 5s30s: neither curve strategy statistically dominates outright momentum.
- Every number was re-executed from the canonical notebook against the original exports in August 2026; that re-execution exposed a transaction-cost loader bug, corrected on 2026-08-23, and the figures here are from the corrected run.
Figures
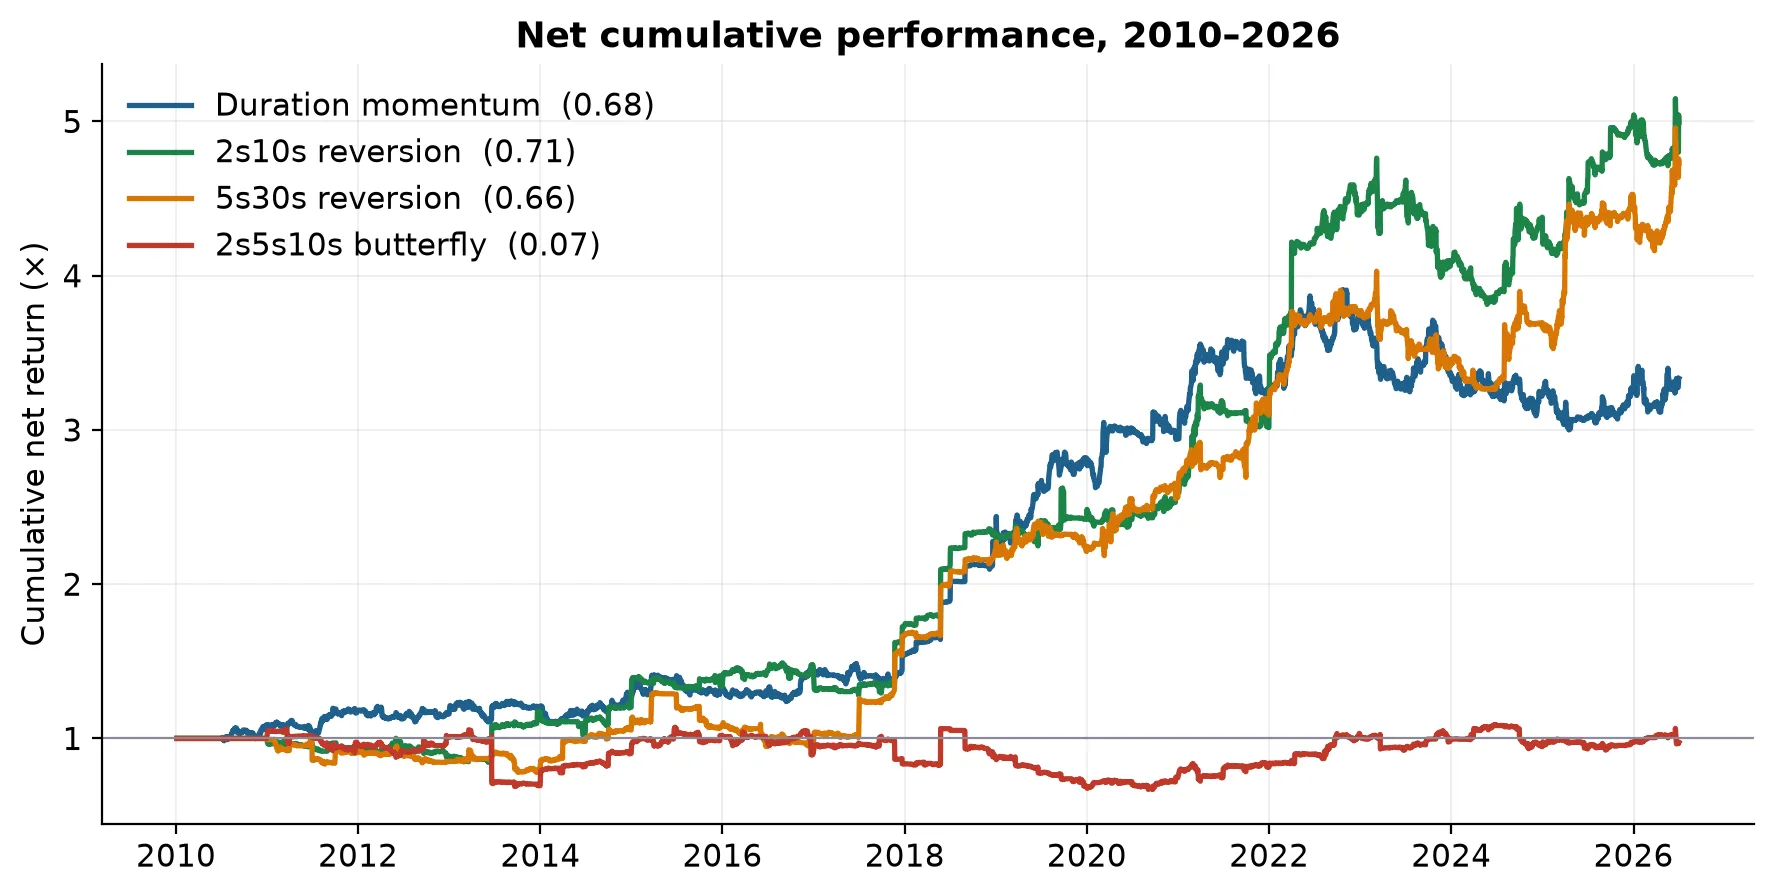
Figure 1. Net cumulative performance 2010–2026: duration momentum 0.68, 2s10s reversion 0.71, 5s30s reversion 0.66, butterfly 0.07. 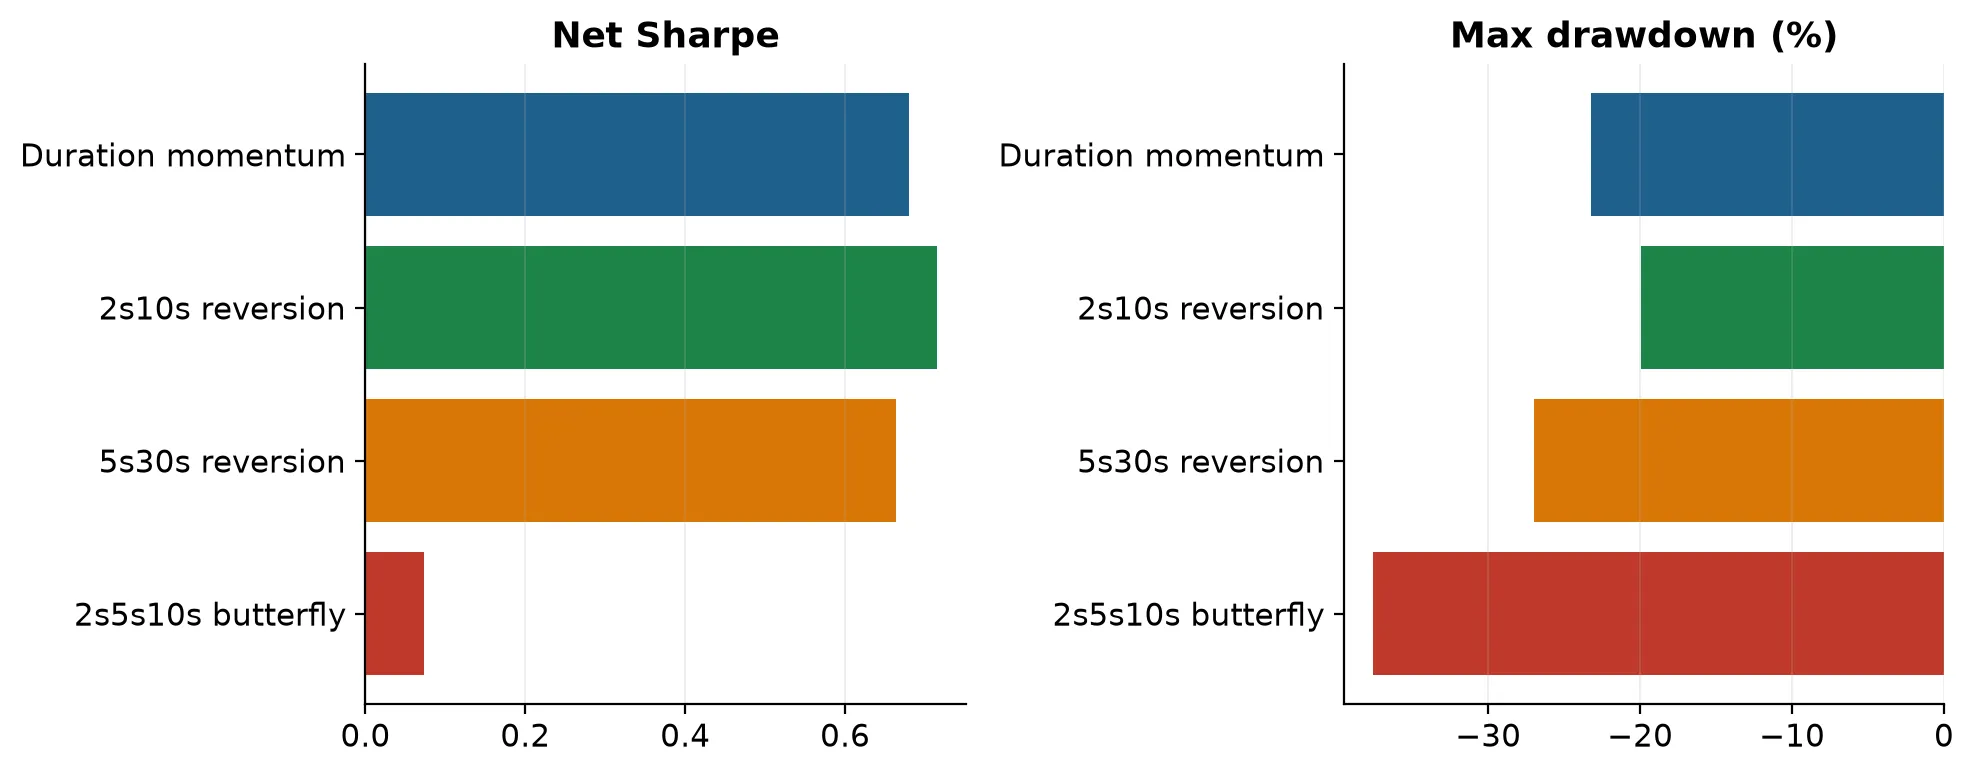
Figure 2. Net Sharpe and maximum drawdown: the curve trades are co-equal with the baseline, not better; the butterfly does not earn its risk.
Robustness and caveats
- The mean-reversion direction for the curve is economically motivated but was confirmed on the full sample; a walk-forward out-of-sample test is still required before treating the curve results as a hard performance claim.
- Single country, single currency; costs are a flat tick-per-side approximation without market impact or financing.
- Inputs are Bloomberg Terminal exports and are not redistributed; the repository ships the exporters, the checklist and a documented free-data route.
- Correction (2026-08-23): the original notebook silently loaded no contract statics, so the table first published as "net" was gross of tick costs (0.71 / 0.77 / 0.73 / 0.12; same-book −0.73 / +0.77; DM p 0.32 / 0.37). The costed numbers are shown here and in the re-typeset paper; no conclusion changed — the ordering holds, both DM p-values move further from significance, and the asymmetry widens slightly.
Challenges
Rebuilding continuous futures from the exchange roll map without booking roll gaps, hedging curve trades with the true daily DV01 rather than a proxy, and resisting the temptation to read a 0.77 versus 0.71 Sharpe gap as significant when the Diebold-Mariano test says it is not.
Learnings
Levels trend, spreads revert, and the signal has to match the instrument. The statistically defensible claim is the asymmetry, not outperformance.